Data Logger

1 Comment

After many trials, finally I was able to complete this small project which had been in my mind for a long time.

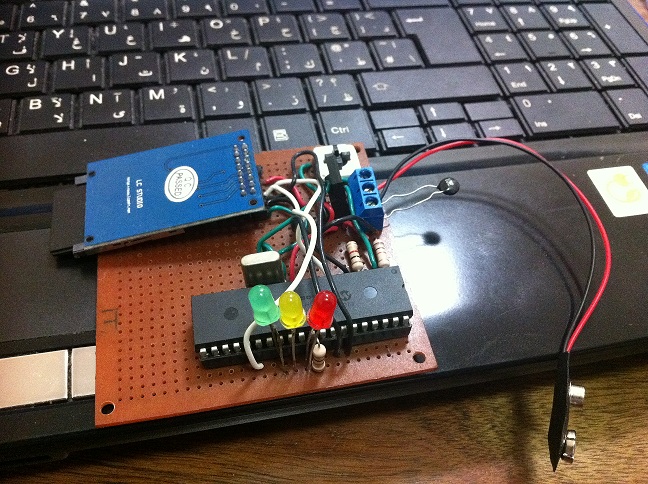
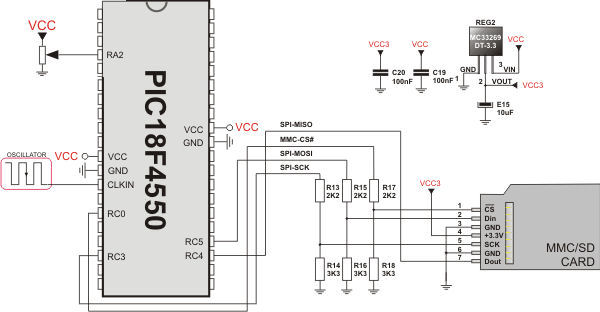
A data logger that store information on SD card. Using PIC18F4550, and one SD card socket I was able finally to complete this project. One Analogue input was added to the board where any analogue sensor can be placed over there. (As of now I am using a temperature sensor (NTC).

The PIC program was made using MikroC. (This made programming PIC much simpler, and saved a lot of time with its gerat libraries)

Below the final circuit picture.

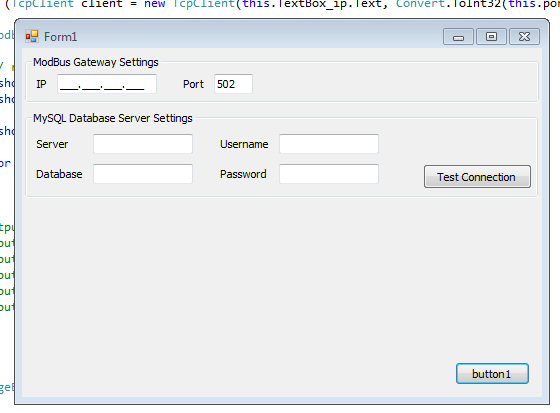
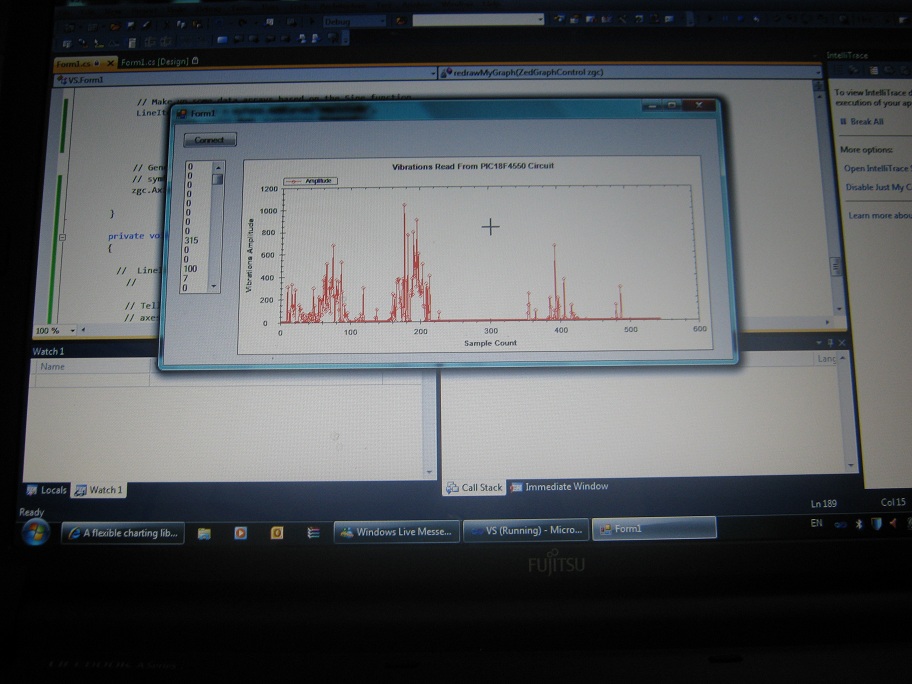
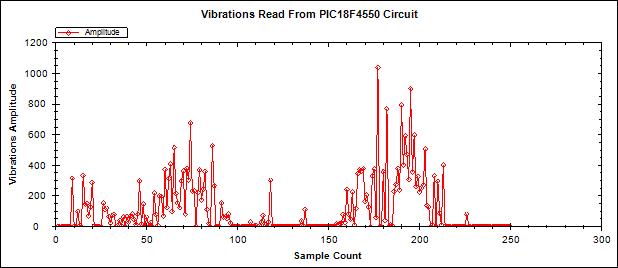
My plan now is to write a small application that would get the logged data, and based on scaling information entered to the software; correct values would be calculated and plotted.

Please let me know if you were trying to build a similar project, and I’ll help you as much as possible.

Code:

// MMC module connections
sbit Mmc_Chip_Select           at LATA5_bit;  // for writing to output pin always use latch (PIC18 family)
sbit Mmc_Chip_Select_Direction at TRISA5_bit;
// eof MMC module connections
long int temp_res;
const LINE_LEN = 16;         ///012345678901234
char file_contents[LINE_LEN] = "XX,XXXXXXXXXXXX";
int temp;
char           filename[] = "TempLogF.TXT";
int i;
unsigned short loop, loop2;


char txt[12];

void M_Create_New_File() {

  Mmc_Fat_Set_File_Date(2010, 4, 19, 9, 0, 0); // Set file date & time info
  Mmc_Fat_Assign(&filename, 0xA0);          // Find existing file or create a new one
  Mmc_Fat_Rewrite();       
  PORTD=0xFF;                 // To clear file and start with new data
  for(loop = 1; loop <= 9999; loop++) {
   PORTD=0b10100000;
  Delay_1sec();
    Delay_1sec();
    Delay_1sec();

     PORTD=0b01000000;


    file_contents[0] = loop / 10 + 48;
    file_contents[1] = loop % 10 + 48;
    
    temp_res = ADC_Read(2);
    LongIntToStrWithZeros(temp_res, txt);
    file_contents[3] = (temp_res / 1000) + 48;

    for(i=4;i<=14;i++)
    file_contents[i] = txt[i-4];

    Mmc_Fat_Write(file_contents, LINE_LEN-1);   // write data to the assigned file
    Mmc_Fat_Write("\r\n", 2);   // write data to the assigned file
   // Mmc_Fat_Write('\n', 1);   // write data to the assigned file
    Delay_1sec();
    Delay_1sec();

  }
}


// Main. 

void main() {
  ADCON1 = 12;                  // Configure AN pins as digital
  CMCON  |= 7;                     // Turn off comparators
  TRISD=0x00;
  TRISA=0b00001111;
   
   PORTD=0b10100000;
   Delay_1sec();
   Delay_1sec();
   PORTD=0b01100000;
   Delay_1sec();
   Delay_1sec();


  // Initialize SPI1 module
  SPI1_Init_Advanced(_SPI_MASTER_OSC_DIV64, _SPI_DATA_SAMPLE_MIDDLE, _SPI_CLK_IDLE_LOW, _SPI_LOW_2_HIGH);
   Delay_ms(10);

   if (Mmc_Fat_Init() == 0)    // reinitialize spi at higher speed
  {
  PORTD=0b11100000;
    SPI1_Init_Advanced(_SPI_MASTER_OSC_DIV4, _SPI_DATA_SAMPLE_MIDDLE, _SPI_CLK_IDLE_LOW, _SPI_LOW_2_HIGH);
    M_Create_New_File();

    PORTD=0b11100000;
   
    while(1)
    {
         PORTD=0b11100000;
         Delay_1sec();
         Delay_1sec();
         PORTD=0x0;
         Delay_1sec();
         Delay_1sec();
     }
  }
  else {
        PORTD=0b01000000;


  }

}

Download Hex File (Finally!!)

Vibration Sensor

No Comments

Finally, and after many attempts to get some results, I got a nice graph on my computer coming from a small vibration sensor that I bout from ebay. It was a big challenge for me (and there are more challenges to come); since that it had been the first time for me to deal with USB port programming, for both Microcontroller and PC.

My aim of this project is to have a vibration data logger, along with possibility to view real time vibrations on the PC.

Best way to work with any project is to divide it into parts, the first part was to establish communication between a Micrcontroller & PC. Utilizing PIC18F4550 gave the possibility for that. Below a schematic for the circuit that I used to get this done.

After a number of trials, I was able to get the data coming out from the chip to the PC.

The Microcontroller was programmed as HID (Human Device Interface); but still it is possible to send and receive data that way. (And no need to write a special driver for your device).


Next step was reading the data coming from the vibration sensor. At this stage I struggled a lot, geting wrong information on the PC after many trial would just get you crazy. Finally I decided to wake up, and read more. Going through some books once again, and most important thing was going through PIC18F4550 datasheet helped me to figure out where I went wrong!. (I am used to deal with PIC16F778, but configuration bits for the timer were different on PIC18F4550).

After getting my Micrcontroller fixed, finally I started getting realistic values (The more I vibrate the sensor, the higher the values I was getting. (Hurrraaaaayyyyyyy).


Below a photo for the sensor that I used for this project (The Vibration Sensor), 
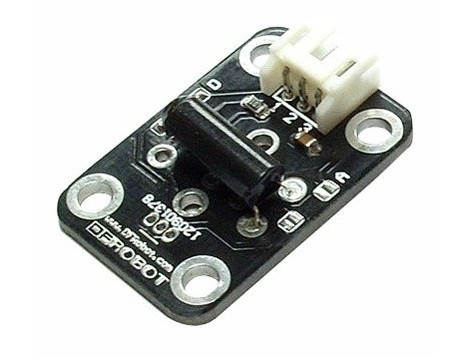
It’s really a very simple sensor, with three terminals only, Output, Vcc, and Gnd.

The only information I was able to find about this sensor is below:

* Digital input module
* Can sense the weak vibration signals
* Switch life: up to 10 million seconds
* Open circuit resistance: 10Mohm

The Digital Vibration Sensor is a digital Plug and Play sensor blocks. It can sense the weak vibration signals, which can be realized with the shock interaction with relevant works.

Product Performance:
* The conductive pin will make an instant turn-on (ON) state when touched by the outside force to achieve the proper vibration force, or an appropriate speed from the (partial) energy.
* No direction, any angle may burst.
* The switch is suitable for small-current circuit (secondary circuit) or (IC) of the trigger.
* At room temperature and normal use the next switch service life is up to 10 million times (times/1sec).

But many thanks to Mr. Sarfraz Dairkee who explained to me exactly how this sensor worked, and what kind of output would be expected from it. And he was really the main person that encouraged me to keep going with this project.

After getting realistic information, it was time to write a PC application that would plot the information. So far, I had been using a USB Terminal software used for monitoring data flow between PC and USB port.

I used my loved programming language C#.NET to write this program, and again, I started without clue on how to do that; but a lot of reading, digging, and googling always help!.

Below some photos for the circuit, and the monitoring program. As of now I am able to read proper values from the sensor, and I am able to send the information to the PC. The next step would be storing data on an SD card. This I have already started working on, but as usual, nothing is so simple. First obstacle was the 32MB SD card that I had. It turned out that it was not possible to read data to this card using PIC18F4550!. Today I am planing to get out and by a new 1GB card. More about this in Part 2.

Loaded Bins Detection Using Ultrasonic Sensor

No Comments

This project was really nice to work on. Beside having it implemented; having all the staff motivated to work with something new; gave good feeling. We have one machine that washes bins automatically when charged in the bin conveyor system as dirty. Those bins are supposed to be empty, since that one machine at the entrance of the bin washer would turn the bins upside down; and again at the exit another bin turner would turn the bins back to their original position. This “Turning” is required otherwise bins would get out from the bin washer full with water.

The main problem since start up; was having operators sending loaded bins as dirty.. Thus you can imagine what would happen to plates, spoons, etc.. when the bin is being turned upside down. Without forgetting the damage caused to the bin turner and the conveyors.


One solution that we thought about was installing an ultrasonic sensor that would detect presence of items in the bin. During one lucky night I found one ultrasonic circuit on ebay that made the entire thing possible. That circuit had a microcontroller that could be programmed to give an output when the measured distance is below a certain value. (That could be configured too.). Below a photo for this ultrasonic circuit along with its technical details:

Features:

  • Ultrasonic display module use small microcomputer system controller ,use STC 10F04XE, fully compatible with 51 microcontroller
  • IO port output pins, two switch output terminal, three key features, three digital display.
  • With DS18B20 temperature compensation circuit Contact Interface
  • Ultrasonic Ranging Module can be used directly measured the distance, you can set the distance alarm.
  • The system can provide ranging program can display panel of the schematic diagram.
  • Wide-voltage : DC 6~12V
  • Work current : 45mA
  • Range : 0 ~ 400 cm
  • Maximum measurement distance : 500cm
  • Test object : about the size of 6cm
  • Size: 45 * 44 * 12 mm


Switch Output:
  • this module’s outputs can be user-defined
  • Press and hold S1 button for 3 seconds, showing LLL
  • Press the S1 key, displays a number (eg 001), Is the smallest measurement distance. When the measured distance is less than this value,OUT2 will output a high level(4.5V)
  • this value can adjustable, use S2 + , use S3 –, to change.
  • When setting the minimum measured value end, then click the S1 key, the display appears HHH, can set Max distance value, Press the S1 key, displays a number (eg 200), Is the max measurement distance. When measuring the distance is greater than this value, OUT1 will output a high level (4.5V). this value can adjustable, use S2 + , use S3 –, to change.
  • when setting is end. press the S1 key,Save this value. With power-down memory function.

Thus the entire idea was to place the sensor above the bin at the entrance of the bin turner. Identifying the measured distance in case of empty bin would be our reference and set point for the sensor. If detected distance is less than that; that would mean presence of items inside the bin!!

The other challenge was avoiding the bins edges (for sure measured distance when the edge passes below the sensor would be less than our setpoint. For that purpose a retro reflective sensor was also installed.

Interfacing the output coming from the sensor with the retro reflective senors along with our bin conveyor system to stop the bin in case of detecting a loaded bin; required a small interface circuit to be designed for this purpose.

When a loaded bin was detected; the N.O output was used to cause the system go into Maintenance Mode; and thus stop. That would also reflect on the monitoring system at the control room.

Currently our bin turner is safe from any intruders!! and the funniest part is when our trap stops some bins loaded with chocolate bars loaded by mistake as dirty bin.!!!

Power Monitoring Project – Part 2

1 Comment

Guess what!! The entire project was completed, and it’s running right now!!!

ModBus windows application had been completed, and it’s doing as expected. (Writing data into MySQL database).

Another thing is the web application, which had been implemented using CakePHP

In this article I’ll just discuss about the web application and discuss what kind of information it’s displaying.


Below the main menu which will be used to navigate throughout the system:

First icon is HOME, which will just send you back to the home page of the Monitoring System.

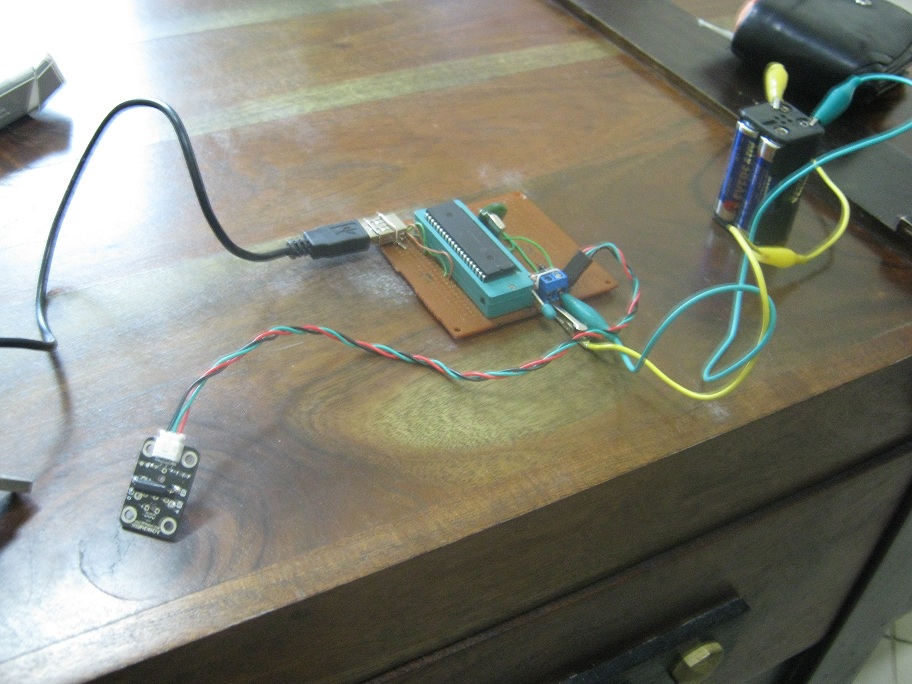
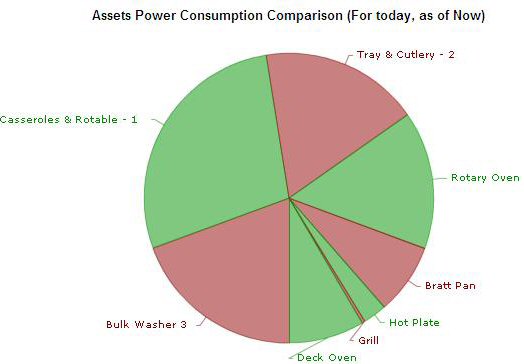
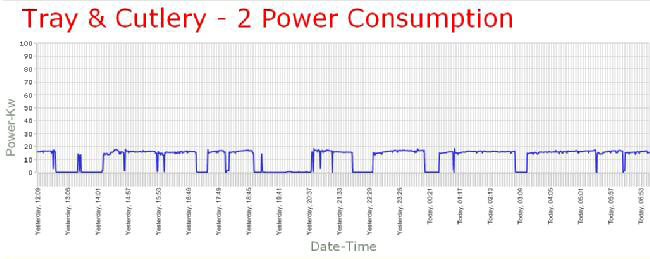
This icon is for Comparison, where it shown a pie for power consumption of all the connected equipment .

This icon will display live power consumption graph for the selected equipment. The displayed graph in the system will keep refreshing every 60 seconds. And hovering the mouse above the graph will display the consumption in Kh.


Clicking on this icon will display a summary for the selected equipment power consumption, and power cost. It will show cost for one day, last 7 days, and last 30 days.


Utilization of each machine can be monitored easily; since that have machines switched off would for sure reflect on the power readings. This information is displayed using this icon.


Finally this function is used to display power consumption during a defined interval.

Kindly note that if you need to work on a similar project; I am ready to share all information you require. Just contact me.

Power Monitoring Project – Part 1

No Comments

Right now I am involved in a new project at work to monitor power consumption per machine. This kind of projects gets you excited and you find your self digging more and more and thinking out of the box to get things done.

The project will start with monitoring 10 machines only, but later it will be expanded. Two main components were bought for this project which are PM9C & EGX100.

PM9C – Power Meter

The PowerLogic Power Meter Series PM9C offers the basic measurement capabilities required to monitor an electrical installation in a 4-module case (18 mm modules).


They can be used to monitor 2-, 3- and 4-wire low-voltage systems and connect to external current transformers. With the large backlit display, you can monitor all three phases at the same time.


EGX-100  Ethernet® Gateway


EGX100 provides cost effective, reliable serial line to Ethernet connectivity in the most demanding applications:

  • Energy management
  • Power distribution
  • Building automation
  • Factory automation


It’s obvious from the above two components, that all what we need to do, is connecting a PM9C to each machines, and then having those PM9Cs connected to the EGX-100 through ModBus cables. EGX-100 is connected to the Ethernet Network, and thus, information can be accessed through any PC connected to the company network.

Software Part

When I ordered the PM9C and EGX-100, I had ordered the PowerView software provided by Schneider. The surprise was a wrong delivery (as usual). And thus I didn’t get the software.


At the beginning; that was sad, but later on I knew that I was lucky! Because I decided to write my own software to read data from the devices, and display them.


After thinking and studying what I have; and what’s required, I thought about having the below solution:

  1. One windows application (using C#.NET) that will read the data from the gateway, and then store the readings in MySQL database.
  2. Web Application built using CakePHP platform to view the information and carry out the required processing on the collected data.


I haven’t thought about those two application names yet, so I’ll call them Windows application, and Web application.

I started so far working on the windows application, and for that I had two main challenges, first one was something that I have not done before, which was having C#.NET to deal with MySQL database.

Why MySQL database? Of course license issues!!


This part has been accomplished successfully utilizing ODBC Driver for MySQL (Connector/ODBC) coming from MySQL website.


That worked out like magic for me, and I was able to deal easily with MySQL using my C#.NET codes.


Second part was reading the information from ModBus TCP network. I found one great open source library for that called “nmodbus”. It was really easy to use, and using some ModBus Emulators I was able to finish that part at home before even having the installation done at work place.


Below you can see the Windows application; but it’s still during its “Under Construction” phase.

This is for now, wait for Part-2 of this article, where I should have finished the windows application completely, and started working on the Web Application.

And if you can help me out with some names, that would be really nice of you 🙂 .